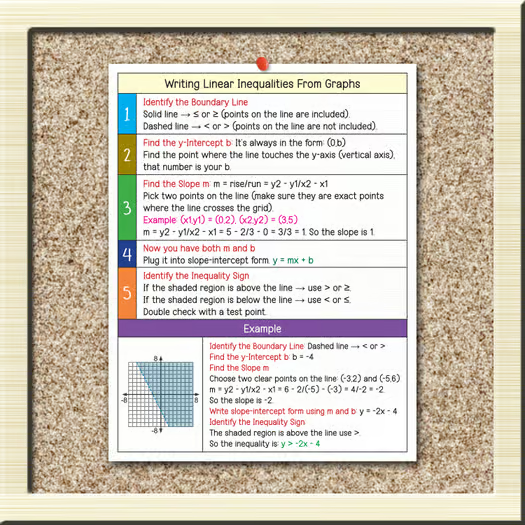
Writing Linear Inequalities From Graphs Anchor Chart
Description
Writing Linear Inequalities From Graphs Anchor Chart
Understanding how to write linear inequalities from graphs can be challenging without clear guidance. This anchor chart is designed to simplify the process with a step-by-step approach that helps students connect what they see on the graph to the inequality it represents. With clear explanations and an easy-to-follow example, this resource serves as a reliable reference tool for both instruction and independent practice. It’s perfect for helping learners build confidence while working with linear inequalities.
What Inside Writing Linear Inequalities From Graphs Anchor Chart
This resource comes as a ready-to-print PDF (8.5×11 inch), making it convenient to use in classrooms or as a study guide. The single-page chart explains, in simple steps, how to analyze a graph and translate it into a linear inequality. A worked-out example is included to model the process, ensuring students have both visual and written guidance to support their learning.
✅ Click the “View Preview” button above the description to explore a sample of the resource.
Why Choose Writing Linear Inequalities From Graphs Anchor Chart
- Provides a clear, step-by-step method to write inequalities from graphs
- Acts as a visual reference tool that simplifies complex concepts
- Saves teachers preparation time with a ready-to-use format
- Supports students during independent practice or review sessions
- Encourages a deeper understanding of graphing and inequalities through clear examples
This anchor chart is a practical resource that combines clarity and simplicity, making the topic of writing inequalities from graphs far more approachable for learners. It’s a strong addition to any teaching toolkit for reinforcing algebra skills.
Related products


Recently viewed