Graphing Linear Inequalities on a Coordinate Plane Anchor Chart
Description
Graphing Linear Inequalities Anchor Chart
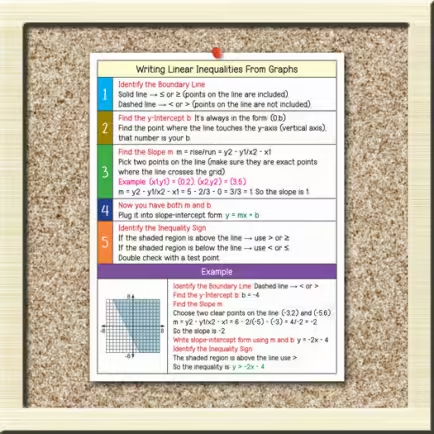
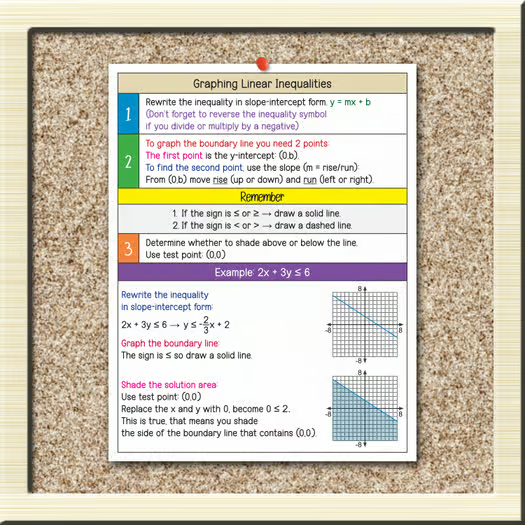
Understanding how to graph linear inequalities can feel overwhelming for learners, especially when they need to remember multiple steps. This anchor chart offers a clear and simple way to break the process down, making it easier to grasp and apply. Designed as a visual guide, it shows students exactly how to move from an inequality to a correctly shaded graph on the coordinate plane. With step-by-step instructions and an example, this chart is a handy reference that can support daily lessons, practice, or review.
What Inside Graphing Linear Inequalities Anchor Chart
This resource comes as a 1-page PDF (8.5 x 11 inches) that provides a complete walkthrough of the process of graphing linear inequalities. It includes clear steps for rewriting equations, plotting boundary lines, determining whether the line is solid or dashed, testing points, and shading the correct region. An example problem is included so students can see each step in action, reinforcing both accuracy and understanding.
✅ Click the “View Preview” button above the description to explore a sample of the resource.
Why Choose Graphing Linear Inequalities Anchor Chart
- Offers a step-by-step guide for solving and graphing inequalities.
- Helps students visualize the process and reduce common mistakes.
- Acts as a quick reference tool during independent or group work.
- Saves teachers preparation time with a ready-to-use visual support.
- Encourages stronger problem-solving skills by connecting algebraic thinking to graphical representation.
This anchor chart provides a reliable reference that students can return to whenever they need extra guidance, making learning smoother and more effective.
Related products