Elapsed Time Strategies Anchor Chart
Description
Elapsed Time Strategies Anchor Chart
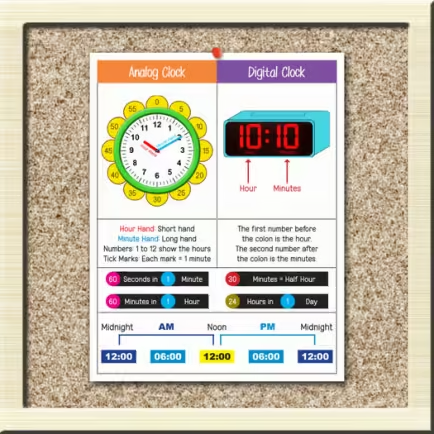
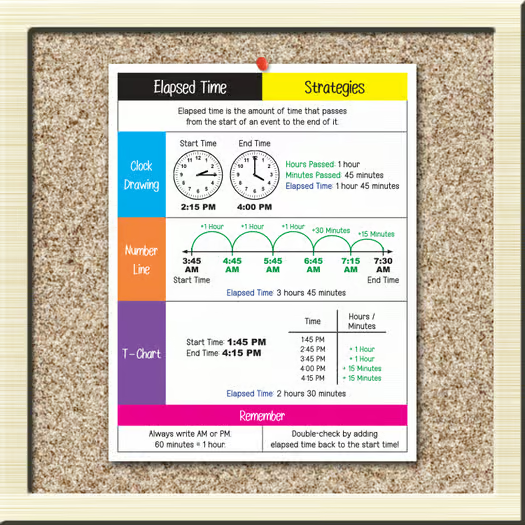
Help your students master elapsed time with this clear and engaging Elapsed Time Strategies Anchor Chart. Designed to support learners in understanding how to calculate elapsed time in different ways, this anchor chart features three easy-to-follow strategies: using a number line, a T-chart, and clock drawings. It’s a perfect visual tool for any classroom working on telling time and solving real-life time problems.
What’s Inside Elapsed Time Anchor Chart
This resource includes a 1-page PDF (8.5 x 11) anchor chart that clearly defines elapsed time and illustrates three strategies to solve elapsed time problems: the clock drawing method, the T-chart method, and the number line method. With bright visuals and simple explanations, it’s ready to print and display for whole-group instruction, small group work, or student reference.
Why Choose Elapsed Time Strategies Anchor Chart
- Helps students visualize and understand how time passes
- Supports multiple strategies to meet diverse learning styles
- Encourages problem-solving and critical thinking
- Saves teachers time by offering a ready-to-use reference
- Builds student confidence in using number lines, T-charts, and clock models
A great tool to enhance your math wall or student folders—this anchor chart makes learning elapsed time easier and more accessible for all learners.
Related products